The project
As with any decision process, you need data. The old interface presented all the data needed to make decisions but in raw format. To interpret the performance of a portfolio the client needed to use external tools, like a spreadsheet, and input formulas and values. Many relied either on their advisors or did mental calculations. Few users had the knowledge or energy to prepare and update a spreadsheet to help them manage the performance of their assets.
Growing the user base also led to increased interaction challenges, such as the need to deliver an improved digital experience to (1) reduce reliance on advisors to execute investments tasks and (2) help clients with their portfolio management.
The use of User Experience Design is considered a key factor to democratize investments as it helps reduce barriers to newcomers from outside the finance sector, by easing the tasks, reducing errors and presenting complex data in a friendly way.
My role
Project leader with a team of 3 UX designers .
Our challenge was to design a new client page that delivered a friendly user experience for both new and experienced investors.
Project
Redesign the client’s page for XP Inc. the largest brokerage firm in Brazil, with 300.000 clients at the time.
Solution
An interface based on portfolio management with tools to reduce common errors and that adapts to different levels of investment expertise.
Impact
Improved user satisfaction. It set the ground for future investment interfaces.
Findings
We talked to different investor profiles, from the newbie to the professional daytrader, to map their investment journey and understand how they made investment decisions.
We identified 4 user personas based on their dependence on an advisor and their level of investing expertise. By organizing these different profiles we started mapping their biggest pain points when managing their investments. A second task was to understand how the present interface was used and what influence it had on their decisions.
We analysed how users managed their investments through the optics of good investment practices, such as portfolio management strategy and Daniel Kahneman’s bias concepts, and prepared a list of design concepts that needed to be implemented to help reduce common investment errors.
Main issues
1.Information Paralysis: with too much information the average user paralyses trying to make sense of what is important and postpones whatever decision he needs to make.
2. Focus on individual assets performance: when considering the performance of individual products, users reacted more frequently to performance, leading to over-trading or anxiety.
3. Using mental calculations to analyse portfolio: Users needed to use a spreadsheet to analyse their portfolio performance and balance, what few did, leading to an incomplete or wrong view of their assets.
How can we help investors move from an individual asset perspective to a portfolio management strategy?
Interface objectives
Reduce overreacting (investment frequency)
Provide comprehensive information to their investment decisions.
Our solution
The new interface included a series of new tools to help users in their investment management.
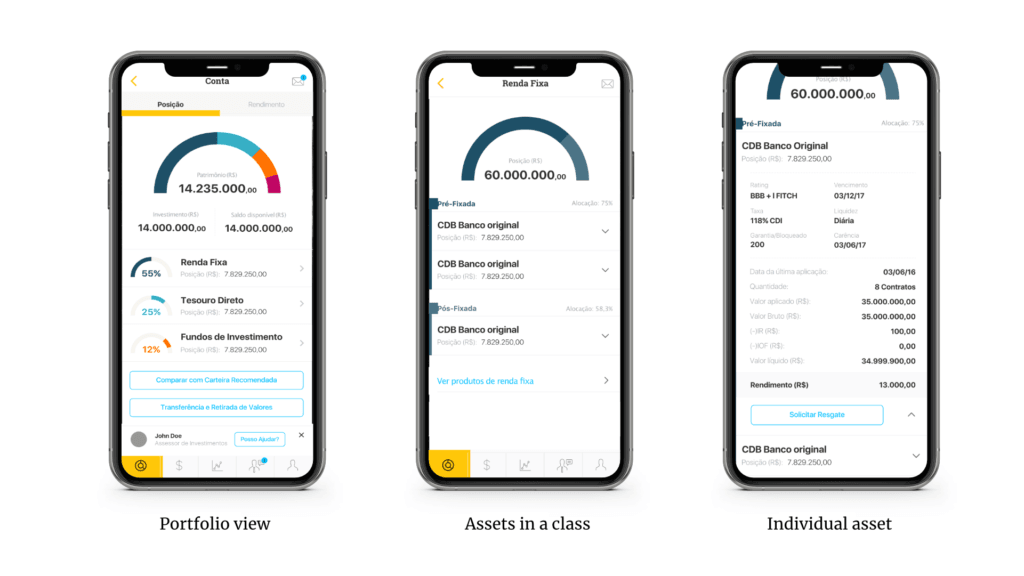
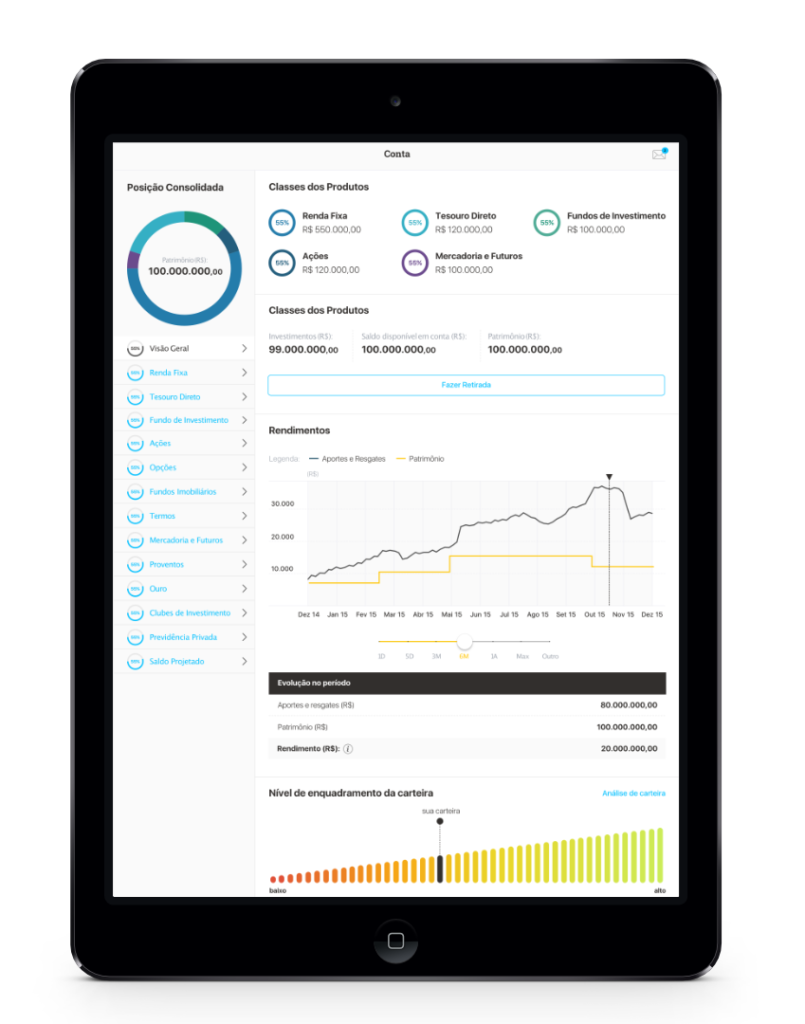
First, we used 3 layers to display all information needed for each task: (1) analysing the portfolio and the balance between different assets, (2) checking an asset class and each product high-level view information and (3), analysing each product performance.
Introducing a new perspective of a portfolio based management XP also helps their advisors as it’s easier to set up more diverse strategies, with better results and better risk management.
Second, we prepared an interface that would substitute the need to use a spreadsheet, with easy to understand graphs and indicators. By organizing values visually and using percentages, we aimed at reducing any cognitive overload of mental calculations, which is always prone to errors.
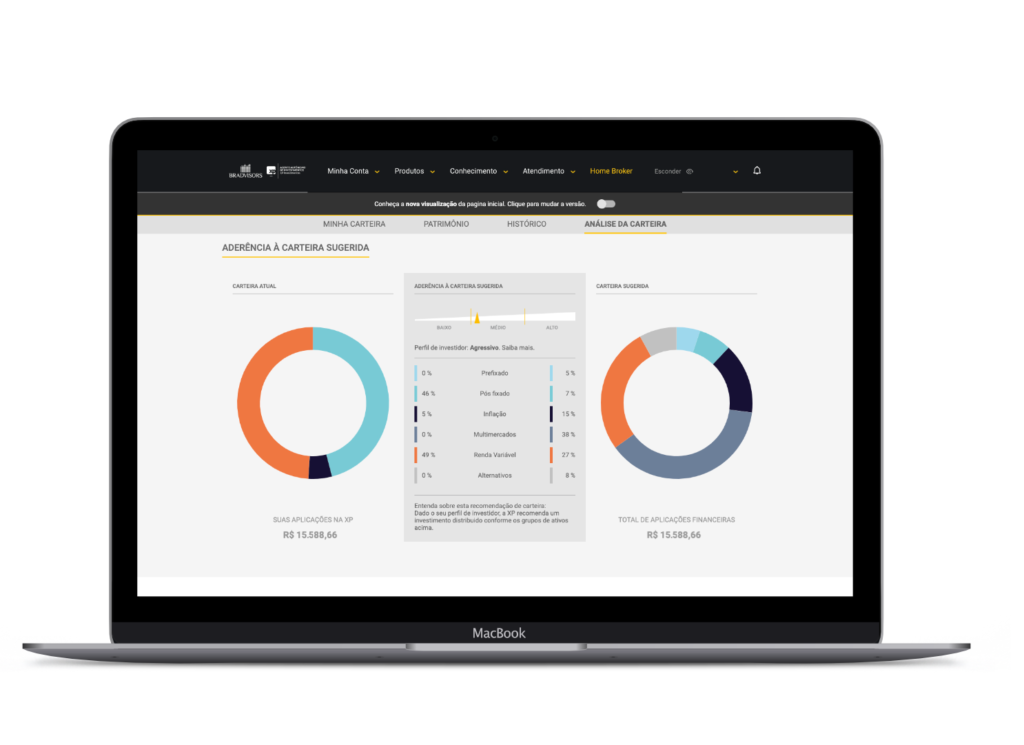
And third, we also helped new investors, that had no access to exclusive advisors ( under 50k in AUM) to set up a solid portfolio, based on XP Inc. recommendations.
Progressive Disclosure in a modular interface
Visual graphs to show portfolio balance and performance
Tools to help with analyse portfolio